Empathy Map Template: Says, Thinks, Feels, Does
What is an empathy map?
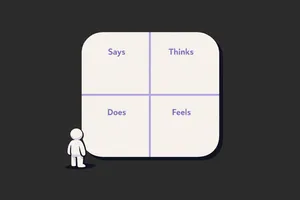
An empathy map is a simple canvas that organises what you know about a user into four areas: Says, Thinks, Feels, Does. It helps teams align on the user's perspective and spot gaps between what people say and what they do or feel.
Use it when: you're synthesising research after interviews or observations, or you want the team to build shared empathy before defining a problem statement or persona.
Copy/paste template
Draw four quadrants (or use a template). Label: Says | Thinks | Feels | Does. Optionally add Pains and Gains.
- Says: Direct quotes from interviews or surveys.
- Thinks: What they might be thinking but not saying (inferences).
- Feels: Emotions, worries, hopes (use emotion words).
- Does: Actions and behaviours you've observed.
- Pains: Frustrations and obstacles. Gains: What they want or need.
Fill from research; if you're guessing, note it as assumption.
Why empathy maps matter
- Make user insight visible and shareable so the whole team can align.
- Surface tensions (e.g. "says X, does Y") that can drive better solutions.
- Support the "Empathise" phase in design thinking and feed into personas and problem framing.
- Quick to run in a workshop with sticky notes.
What a good empathy map includes
Checklist
- Based on evidence - quotes and observations, not only assumptions (label assumptions if you add them).
- One user or segment per map - don't mix different user types.
- Filled collaboratively - so the team shares the same picture.
- Pains and gains - so you see obstacles and desired outcomes.
- Used - linked to a problem statement, persona, or next step; not left on the wall.
Common formats
- Classic four quadrants: Says, Thinks, Feels, Does. Use in workshops.
- With pains and gains: extra row or section. Use when you're defining problems or value.
- Comparison map: two maps side by side (e.g. before/after, two segments) to compare.
Examples
Example (the realistic one)
After five interviews with small business owners about invoicing, the team runs a 30-minute session. Says: "I just want it to be simple." "I forget to chase people." Thinks: "Will this take long?" "I hope I'm not overcharging." Feels: anxious about late payers; relief when paid. Does: uses spreadsheets; chases by email and phone; sometimes gives up. Pains: time spent chasing; awkward conversations. Gains: get paid on time without hassle. The map feeds into a problem statement and a persona.
Common pitfalls
- All assumption, no research: the map is guesswork. → Do this instead: run at least a few interviews or observations first; mark any inferred content as assumption.
- Too generic: could apply to anyone. → Do this instead: focus on one segment and one context (e.g. "freelancers doing invoicing").
- Never used again: one-off workshop output. → Do this instead: connect to a persona, problem statement, or backlog; revisit when you learn more.
- Mixing users: one map for "everyone". → Do this instead: one map per user type or segment.
Empathy map vs. related concepts
- Empathy map vs persona: an empathy map is a synthesis format (says/thinks/feels/does); a persona is a character that represents a segment. Use the map to build or enrich the persona.
- Empathy map vs journey map: a user journey is over time (steps/phases); an empathy map is a snapshot of the user's mindset and behaviour. Use both: empathy map for "who they are"; journey for "what they do when".
- Empathy map vs empathy mapping: same idea; "empathy mapping" is often used for the workshop activity.
Related terms
- User research - the source of says/thinks/feels/does.
- Persona - empathy map output often feeds into personas.
- Design thinking - empathy map fits the Empathise phase.
- Problem statement - use pains and gains to frame the problem.
- User journey - journey over time; empathy map is a snapshot.
- Jobs to be done - job and context complement the emotional side of the map.
- Empathy mapping - the process of creating empathy maps.
Next step
After your next round of user research, run a short workshop: fill one empathy map per segment, then draft one problem statement from the pains and gains.
Related Articles
-
Empathy Maps: How to Use Them Without Wasting a Workshop
The empathy map goes on the wall on a Tuesday. By Thursday, nobody looks at it. By the following Monday, someone has pinned a sprint schedule on top...
-
Product Designers and AI: Staying Human-Centered
The product design field is experiencing its most significant transformation since the shift from print to digital. AI tools can now generate...
-
Why Product Design is Important
When most people think of product design, it's still "make it look nice," with buttons, colours, and layouts. But that's just the surface. The real...